Sometimes I feel that these are the three most important graphs of my lifetime

From the Federal reserve, on generational change in wealth accumulation:

EKKmm93WwAMWQQc.jpg

From Lane Kenworthy, on the distortion of political representation in the US Senate:

numberofsenators-by-statepopulation-us-2015.png

From Thomas Philippon, on the growth in market power of the largest firms:

2020-06-24_15-41-38.png

Sometimes, not always, but sometimes, I feel that 80% of the social disorder I’ve seen during my life can be understood pretty well through these three graphs.

Who gets to be mainstream, part 2, race, generation, and home ownership

Last time, I looked at differences in home ownership between older and younger folks between 1960 and 2018. Briefly, it looks like home ownership, one of the big anchors of membership in mainstream middle+ class society, is growing increasingly stratified across generational lines.

Why is this trend occurring? I speculated that two factors could contribute to these changes: racial and educational compositions of generations.

For example: social scientists have demonstrated the vast social, economic, political, micro-, meso-, and macro-level factors that make access to home ownership unequal across racial and ethnic groups. With younger generations more racially and ethnically diverse, perhaps these barriers are more consequential in driving trends. That is, trends may look more flat when looking within racial and ethnic groups. The trend lines for overall generations may be due to changes in the compositional makeup of generations.

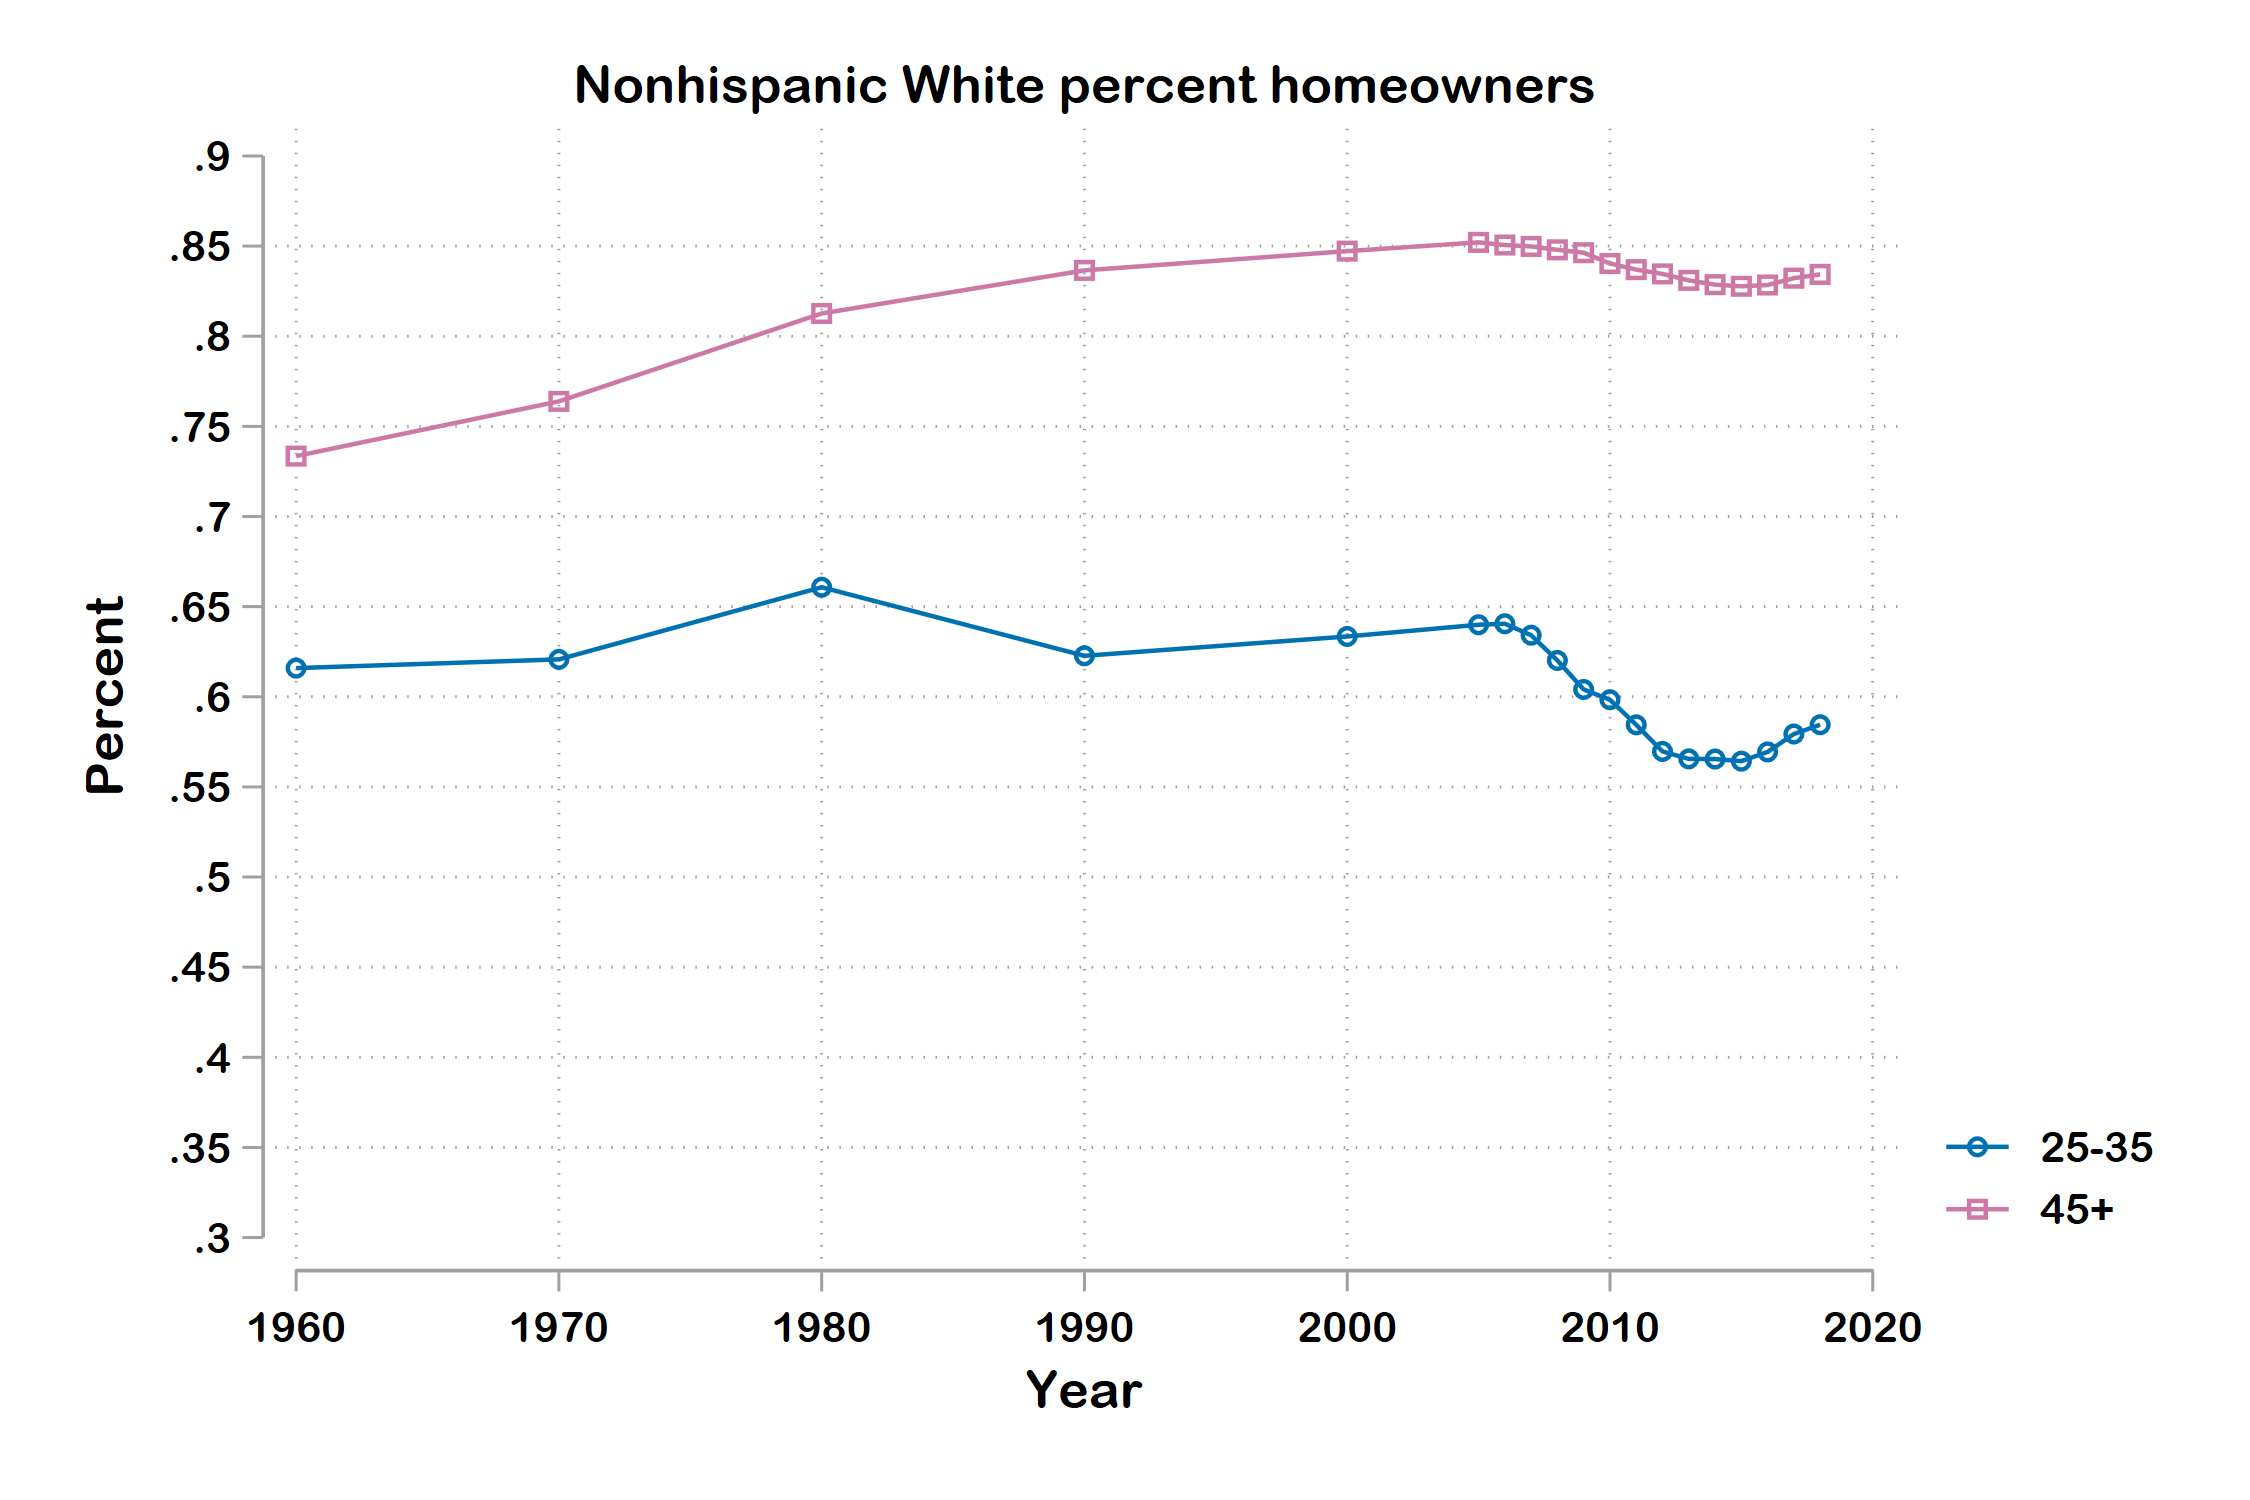
Let’s start by comparing generational home ownership differences among nonhispanic white and black populations (this is already going to be a tad long, so other racial and ethnic group trends will have to wait for another day). Like last time, I’m using Census and American Community Survey data of non-institutionalized populations, looking at year specific groups aged 25-35 and 45+ to roughly proxy younger and older folks.

_blog05-homeownership03.png
_blog05-homeownership05.png

Unsurprisingly, the y-axes are, by far, the biggest story. Middle-aged black folks have home ownership rates similar to those of young white folks. Sociologists and demographers are all over the massive racial and ethnic inequalities associated with housing. South and Crowder’s Cycles of Segreation is a great recent book on the topic.

But we also see different trends in generational gaps between white and black populations:

  1. The generational gap in home ownership among white folks has consistently grown over time, from a difference of 0.1 in 1960 to over .25 in recent years.

  2. In contrast, the generational gap for black folks had a single big growth in the 1980s, but has otherwise been pretty flat. This appears to be the case because there simply hasn’t been a lot of upward action in the rate of home ownership among black folks, regardless of age, since 1980. The only trend that’s notable was a decline in home ownership among both older and younger black folks following the Financial crisis of 2008.

  3. The size of the generational difference is now pretty similar between white and black folks. Before, it was about twice as large for black folks.

  4. The overall trend lines show that the Great Recession was pretty bad for everyone, except older white folks, who were overall able to maintain high home ownership rates.

Let’s compare young white and black rates over time:

_blog05-homeownership15.png
_blog05-homeownership16.png


There’s a slight converge in the substantial gap between younger white and black folks between 1960 and 1980, with the difference in home owner percentages declining from about 0.3 to about 0.225. In the 2000s and onward, there was some volatility in the difference between years, but nothing to write home about.

How about older folks?

_blog05-homeownership17.png
_blog05-homeownership18.png


Well, here we see the two groups pulling apart in recent years. Older white folks are becoming increasingly likely to own homes compared to older black folks. Whereas the gap was about 0.18 in 1980, it has grown pretty steadily to about 0.25 by 2018. So, we now see homeownership gaps between older white and black folks that are about the same magnitude as the homeownership gaps among younger white and black folks.

So what does this all suggest?

  1. The generational gap is growing among white folks, presenting a new and unusual generational divide among a group that has tended to have greater access to society’s valued resources. In contrast, there has been a consistent and large generational gap in homeownership among black folks.

  2. There was a slight decline in the racial disparity between younger white and black folks, but this largely stagnated in the last 25 years or so. In contrast, the disparity among older folks has grown in the last 30 years.

  3. These results run against the expectations I brought in. I thought that perhaps younger white folks were maintaining privilege compared to past generations, and that the aggregate decline was due to a more diverse younger generation. Instead, we see a consistent disadvantage faced by younger and older black folks, and a separation between older and younger white folks. Perhaps this is why housing costs, discussions of stunted adulthood, renting, etc. is so prominent in discussions about Millenials — these disadvantages are now more prominent among a traditionally more privileged group, making it more noteworthy and resonant among folks who typically have hold over national discussions.

    • BUT — let’s not lose sight of the massive racial gaps. Young white folks today are having a tough time…but…their home ownership rates have now dropped to rates of older, and presumably more established in their careers, black folks! That’s a clear indicator of the massive racial inequalities that perpetuate across generations.

Who gets to be mainstream, part 1?

Something that I see bubble up time and again is the notion of substantial generational change in access to a variety of touchstones of adult life that connect young people to mainstream society. This manifests in a number of different ways: concerns about the substantial lack of wealth that Millenials have compared to similarly aged Baby Boomer and Gen X’ers, the lack of home ownership in younger generations due to astronomical housing costs in affluent cities (I remember a comedian saying that young people live in their phones because it’s the only home they can afford), the decline and delay of marriage and parenthood, the problems of unpaid internships replacing entry level jobs, the extension of time spent living with parents into one’s 20s, etc. .

I think that access to these perhaps more traditional transitions to adulthood are consequential for a few reasons. Psychologically, they provide signals to oneself and others that a young person has “made it,” or successfully transitioning fully into adulthood. I imagine that this affects one’s view of oneself and one’s self esteem. They may also reflect a young person’s economic and social stability: housing, employment, marriage, entry internships, etc. have large costs associated with them these days, suggesting that they signify the proportion of young people in an economically stable situation. Further, I imagine that many of the touchstones of transition to adulthood mentioned above put constraints onto one’s life that prioritize predictability and security, and extend the conceptualization of one’s life and behavior as having consequences across a longer period of time. If young people are locked out of attaining these adulthood touchstones, then they may be less invested in social stability. Or if you’re locked out of these things, you may feel that society is not working for your benefit, and you’re probably correct.

I’m curious about how these adulthood transitions have changed across generations. My hunch reading popular news and social media is that there is a substantial general decline across generations in access to touchstones of adulthood transition. I’m going to start out thinking through this idea by considering trends in home ownership.

I used Census and American Community Survey data, which includes information on whether an individual owns or rents their home. I’m conceptualizing “young people” as noninstitutionalized individuals aged 25-35. It’s not a perfect proxy for “young people,” but it should provide a sufficient window at the end of youth to capture the extent to which the year-specific younger generation has attained each of the mainstream anchors of adulthood.

Let’s start out by comparing trends in home ownership among younger people and older people. The lines below represent the percent of folks aged 25-35 who own a home (blue line), and the percent of noninstitutionalized folks aged 45+ who own a home (pink line).

_blog05-homeownership01.png

OK. This is definitely looking like younger people are not able to get connected to one of the big anchors of mainstream society. Beginning in 1980, younger folks have had declining home ownership rates, from about 62% in 1980 to 55% in 2006. Unsurprisingly, home ownership rates plummeted during the Great Recession, to under 50%. Young folks’ home ownership only started bouncing back in 2017. Yet it bounced back from a historically low rate.

By comparison, home ownership rates increased for middle- and older-aged folks between 1960 and 2007, from about 71% to a touch over 80%. Home ownership for this group declined during the Great Recession too, but at about half the magnitude of younger folks, from 80% to about 77%.

To show the age gap, let’s look at the difference in these percentages over time.


Yeesh. Home ownership among those aged 45+ was about 13 percentage points higher than those 25-35 in 1960. A difference certainly, but nothing suggesting a massive generational gap. This gap has steadily grown over time, so that home ownership was almost 30 percentage points higher among older folks by 2013. The gap’s declined a bit since then, but its magnitude is still pretty massive by historical standards. Over the last 60 years, it looks like we’ve gone from a reasonable generational difference in home ownership that could be explained by the typical upward economic attainment that typically flows along the life course to a massive chasm between generations.

There’s way more to unpack. But this definitely looks like younger folks are on the outs of one of the big pillars of entering mainstream American society. This could be a push - younger folks may want to own homes but cannot - or a pull - perhaps younger people are more flexible and mobile. The youth-specific crash in the mid 2000s suggests to me that young people didn’t suddenly learn of the perks of renting right at the beginning of a home valuation expansion.

I’m wondering, though, how universal these trends are. Specifically, I suspect that there are two big group dynamics that could affect trends (these will be future posts):

1] Higher education: My hunch is that there is a large difference in adulthood transitions for young people based on educational attainment, but that the gap has shrunk over time, with fewer college educated young people attaining adulthood touchstones. My other hunch is that less educated people have either stagnated or declined in access to these over time. I’m biased in assuming that national narratives, cultural memes, and “newsworthy” stories are biased in favor of higher class and highly educated people. So I’d expect a larger relative decline among higher educated folks (hence the bubbling stories), but that they’d still be doing much better than less educated folks.

2] Race: Younger cohorts are more racially and ethnically diverse. Racial and ethnic minorities face a substantial set of economic, political, and social barriers to typical anchors of mainstream society. We might well be observing generational decline in attainment to mainstream activities, but this could simply be due to the fact that younger cohorts are more diverse than older ones. Young white cohorts may look a heck of a lot like older white cohorts.

But this post is getting too long. These will be for another day.

At the beginning, I'm always wrong, inequality edition

I’ve been listening to the audiobook version of Daniel Markovits’ The Meritocracy Trap: How America's Foundational Myth Feeds Inequality, Dismantles the Middle Class, and Devours the Elite. It provides a compelling argument for why the mechanisms of meritocracy — which seem like they should expand opportunity and reduce class rigidity — have ended up creating a system of injustice and social reproduction at the top. It also discusses why the notion of meritocracy, in its current experienced form, creates a bunch of downstream problems in society, and why it’s so difficult to argue against the idea of meritocracy.

I’ve been enjoying listening to this book. Markovits is a law professor at Yale and has special qualitative access to the inner workings of the contemporary “Meritocracy Trap” which makes his assessments all the more compelling. As someone who is interested in inequality, some of the points about inequality are a tad redundant from my other readings, and argumentation from inequality trends can be a tad overly blunt and deterministic for my taste, but the driving kernel of the book is fantastic.

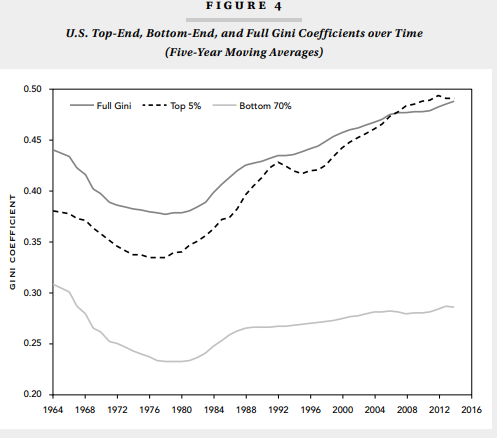
One point that stuck out to me was in Chapter 4. Markovits argues that inequality in the top 5% of income earners is substantially larger than inequality in the bottom 70% of the income distribution and that this gap has grown over time.

Later I looked at the .pdf book companion and saw graph corresponding to this point.

2020-05-25_11-47-01.png

Wow! Compelling stuff. Inequality scholars have similarly highlighted top income earners as driving inequality over time. So this generally aligns with the story I’d expect to see, but the magnitude of the difference of the two subgroup Gini coefficients was very striking! Markovitz notes that inequality among the bottom 70% resembles Norway, and inequality in the top resembles India.

I like making Gini coefficients myself and never thought to construct them in different parts of the income distribution. I’m flying a bit blind because the notes don’t totally explain the construction of the coefficients. I’m not entirely sure whether these trends refer to wages, annual incomes, annual incomes of all workers or those not self-employed, or household incomes. I’m not sure whether age ranges are restricted to those of working age or not. But it’s a public facing book, so I don’t hold that limitation too much against it.

I decided to tackle this topic too, but I’m having a bit of trouble replicating some of the results.

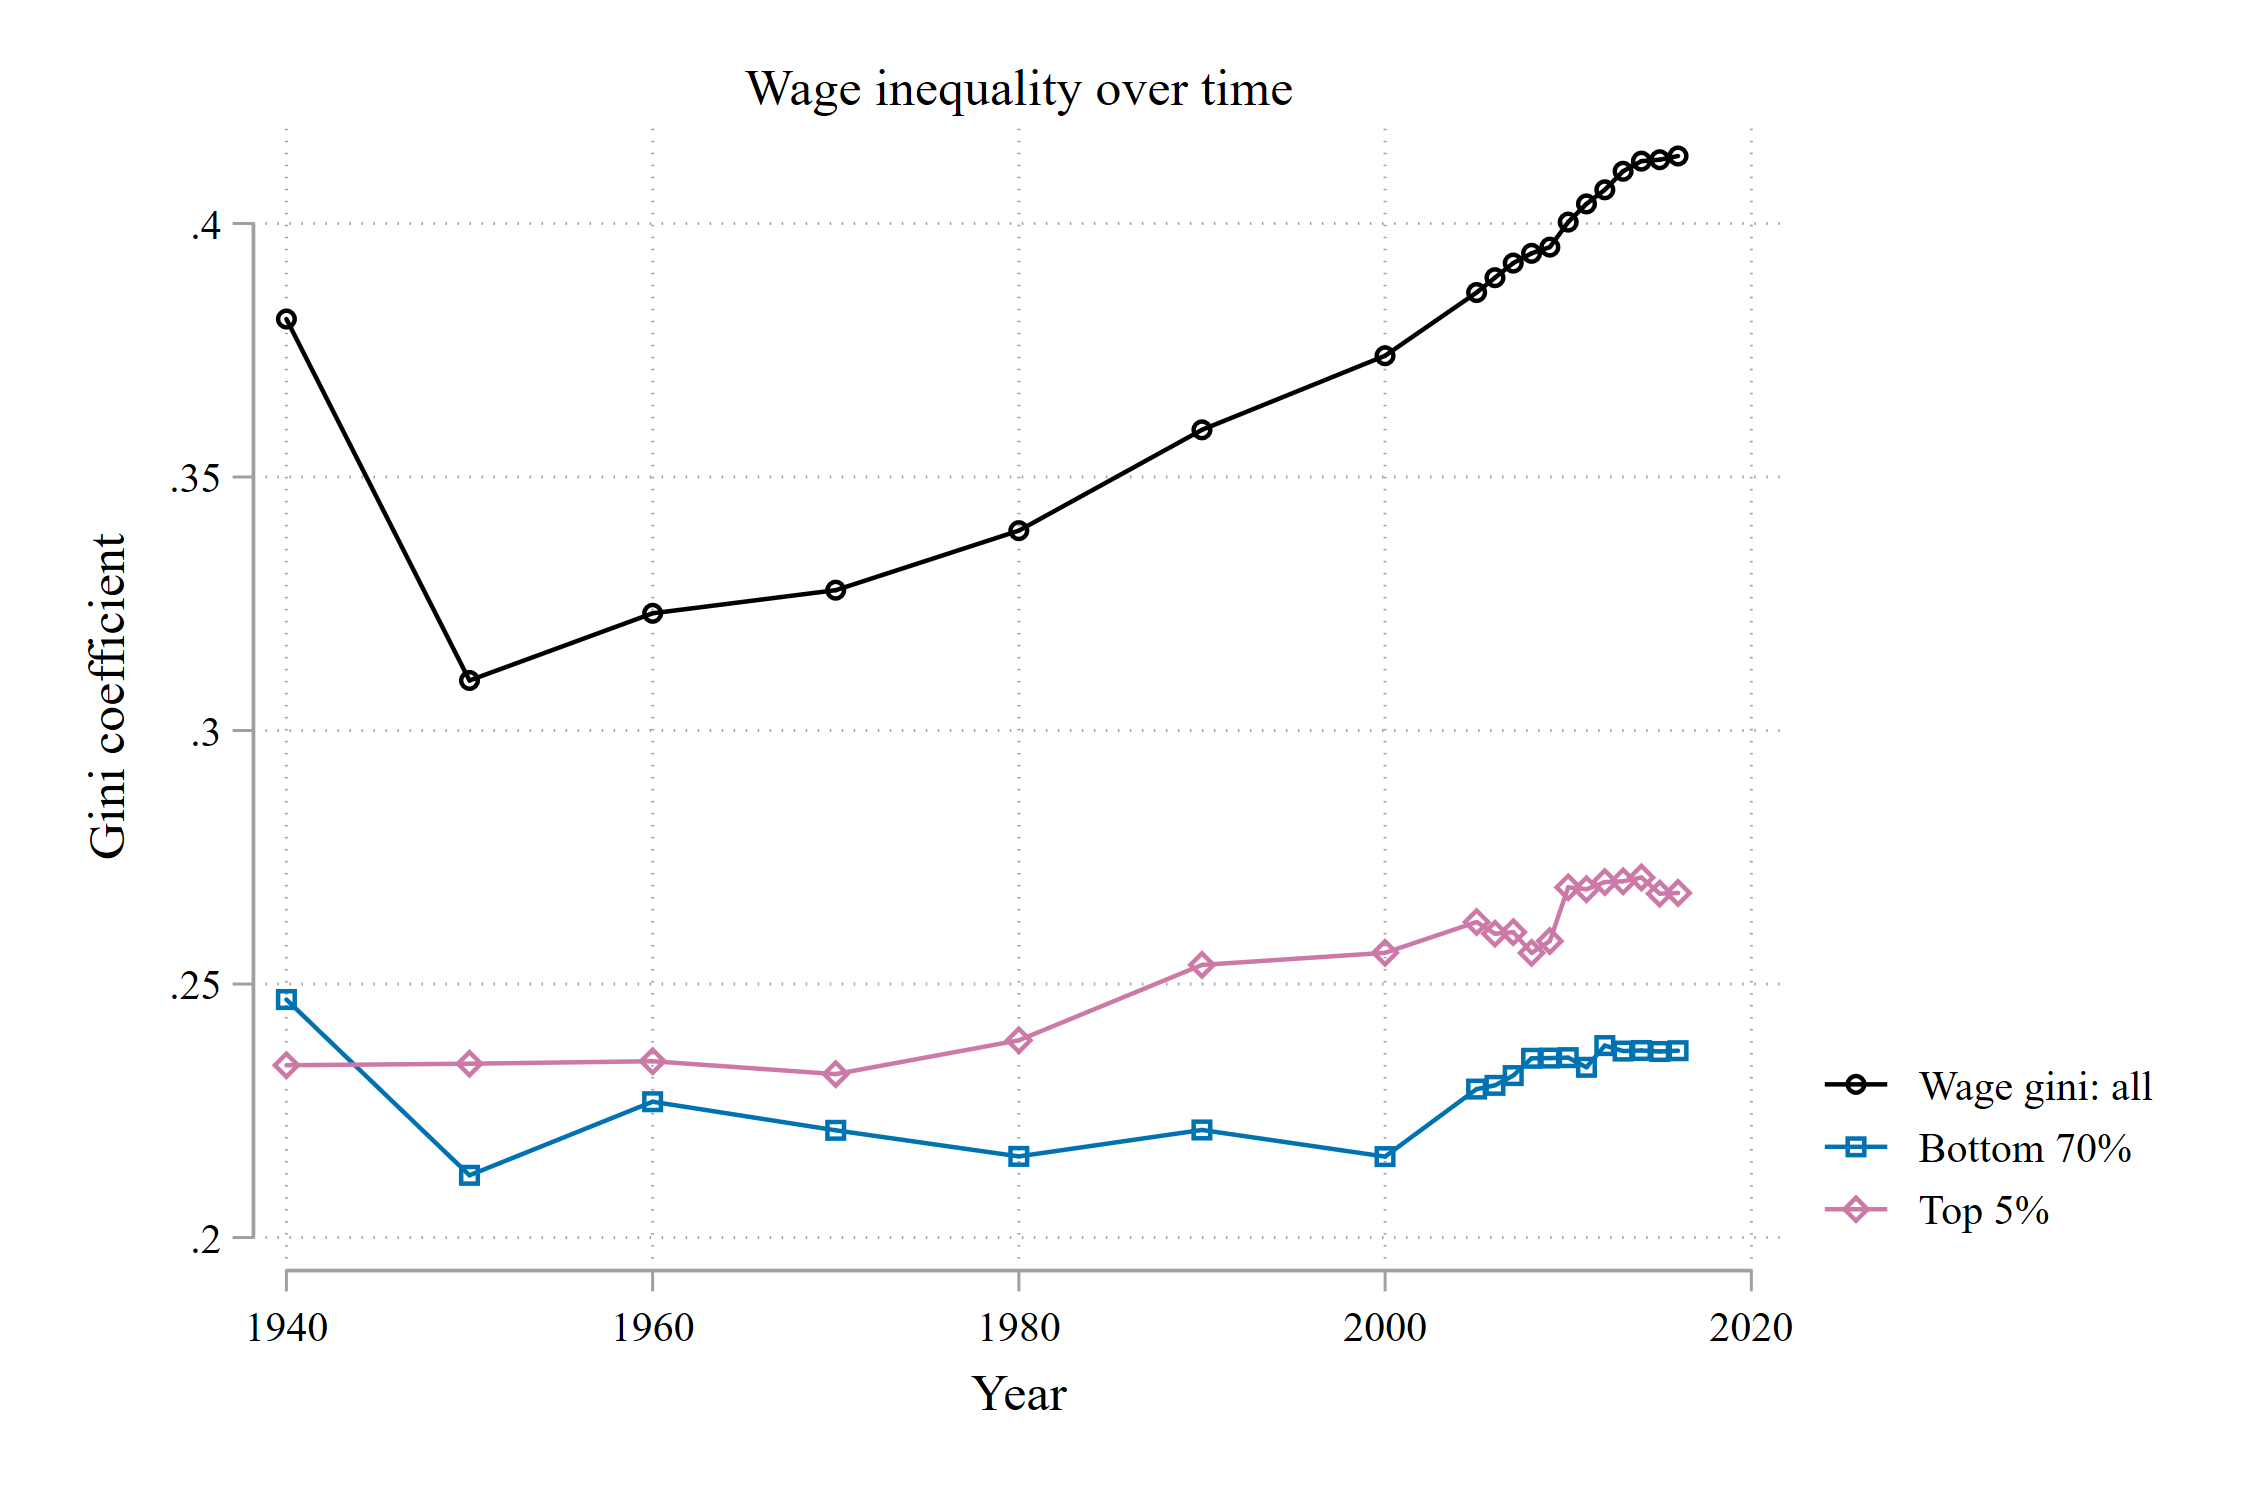
First, I decided to take a look at wages, because wage inequality is a major focus in my own work. Wages are also the workhorses of most inequality trends among the “bottom 99%.” While I think that’s interesting, it probably means that I’m missing many of the people who Markovits is talking about. I’m using Census longform and American Community Survey data between 1940 and 2016. (notes at the bottom describe the sample a bit more)

_blog-ginigplaces.png

Hmm, some of the trends here are similar to Markovits’ figure, and some aren’t.

  1. Inequality among the top (95th wage percentile and above) and the most (70th percentile and below) were pretty similar from 1940 to 1970. We start to see the two diverge at 1980.

  2. Inequality among the most has grown a bit in the 2000s, but top inequality remains distinctively higher. Top inequality is about 3 Gini points higher today than most inequality. This divergence is a major event for the contemporary high-inequality era from 1990 onward.

  3. I don’t see the massive gap in Gini coefficients between the top and the most.

  4. In my mind, it kind of makes sense that top inequality and total inequality wouldn’t totally overlap. A big driver of overall inequality is the separation of top wages from median wages. That growing gap isn’t accounted for in the figures, but should contribute significantly to overall inequality trends.

Next, I thought I’d try total annual income inequality, from sources not just salaries and wages. This should get some more spread, and it includes self employed workers, which should be important for top-end inequality.

blog-data02-clean.png

We don’t see the massive amount of top inequality compared to the rest. It’s easy to see the general stagnation of inequality among the bottom 70%, and the rapid growth of inequality among the top 5%. By 2000, inequality in the top equaled, or outpaced, inequality in the bottom 70%. Even though the figure isn’t as striking as the one from Markovits’ book, I still find it striking and illustrative of the revolutionary era of inequality we live in.

But again, I can’t find the trend where the top is India and the bottom is Norway.

Finally, I thought I’d try household inequality. Incomes in a house are typically pooled. With the rise of dual earning households and the class stratification of marriage, perhaps the big trends identified by Markovits occur at the household level:

_blog-ginigplaces2.png

Hmm…no again. Household inequality has been growing since 1980. But I don’t see much action in either the bottom 70% or the top 5%. And here, we see much more inequality among the bottom 70% than among the top 5%. Lots of the overall inequality growth since 1990, I imagine, comes from the separation of top income households from those in the middle and bottom.

It’s tempting to say that the figure in Markovits’ book is incorrect. I do not claim this. Why?

  1. If I’ve learned one thing during my time in this academic gig, it’s that I should always, always assume that I personally did something incorrectly and search like hell for where that mistake occurred. Scott Long discusses “the universal aptitude for ineptitude.” I’ve repeatedly learned the truth of this phrase. It’s highly likely that I’ve made some boneheaded mistake interpreting Markovits’ figure, or in constructing my own. I haven’t spent as much time making these figures as I would if I were writing a real piece of research. Here are my main suspects of where I screwed up:

    1. Perhaps top-codes in the Census are not correct to assess the influence of very high earners. I’m using the coding logic of David Autor and David Dorn, so I feel pretty comfortable with my decision as applied to employed individuals at the 99th percentile and lower. But that 1% can make all the difference, especially for recent inequality trends. I’m suspicious that the total of the difference could come from top coding, but it’s possible.

    2. I may be using the wrong sample or income definition. Perhaps Markovits is presenting wealth inequality? His presented trends would definitely align with what I’d expect for the wealth distribution. Alternatively, perhaps he is including ALL individuals over 16, not just those of working age? That might narrow the folks in the top 5% to those at the very, very top. Perhaps he includes zero incomes? There are so, so many ways that samples can be defined and income can be coded.

So where does this leave us? At the moment, I would tentatively claim the following:

  1. I agree with Markovits that income and wage inequality among the top 5% of earners has grown substantially and now outpaces inequality among the bottom 70%.

  2. I disagree with Markovits on the strength of the comparison of inequality between the top 5% and bottom 70%. I couldn’t find a situation where one was India and the other was Norway.

  3. I agree with Markovits that focusing on this topic is of utmost importance. Despite my counter claim in point 2 above, the growth of inequality in the top 5% still has massive consequences for the relative and comparative components of income. I think this point drives his book, and I think my evidence aligns with it.

  4. I believe Markovits’ findings are restricted to individual earnings, not pooled household incomes.

  5. Why are all my pink and blue lines so much lower than the overall black line? Well, while inequality within the top 5% and the bottom 70% are very important, the gap between the top and the middle has grown substantially over time, and has been very important for inequality too. I think the contribution of the top separating from the rest is masked in the figures of this post.

Notes:

Wages: Sample is employed, but not-self employed, not in group quarters individuals aged 16-64, with non-zero earnings. Wages are bottom-coded at 1/2 the year-specific minimum wage. Top codes are roughly applied by multiplying wages in the 99th percentile and above by 1.5

Income: Any non-zero income, positive or negative, from any individual aged 16 and up. Income from all sources, not just salary and wages. Top codes are 1.5 times the 99th percentile. No bottom coding.

Household income: Incomes (discussed above) are pooled among household units.

Some thoughts on working at home with kids, part 2. Global pandemics are different

I previously listed some ideas and habits that I found helpful while working with minimal childcare between 2015 and 2019. The big picture points: all hours are on the table, simplify the conception of your life, shift to an hour-based work mindset, and don’t look at the internet. These are more eloquently put in a CGP Grey video, (weekends are youtube time for me!!).

I’ve been…ok at following this advice. But I’m also finding that working from home with no childcare during a global pandemic is massively different than working with no childcare without a global pandemic.

1. There’s no way around it: the stressors of a global pandemic, the health of my loved ones, worries about work, about the massive changes to economic, political, and social life, and worries about the future of higher education have seeped into my work and childcare. I’m finding that it’s very different to operate effectively with this slow-burn stress in the background. These stressors make it harder to concentrate on work, and they make it harder to lean into childcare while shutting off outside stimuli. They seem to launch me into all my time-wasting bad habits with greater ease and frequency. It was a heck of a lot easier to follow through on my decision to prioritize childcare when it was on my own terms.

2. Parks and recreation. Work is so, so much harder when two people are constantly working from home, when you cannot leave you home, and when you cannot take your kids to burn off energy at parks, museums, coffee shops, etc. Dear lord, how I long for an outing to a playground.

3. Our kids finally adjusted to daycare. We spent August through February getting both our kids adjusted to daycare rhythms. We finally … FINALLY … got to a place where our two-year-old wasn’t sobbing uncontrollably when we left him. The first month of the pandemic was about adjusting our kids to not being around other children. Especially for our five-year-old, this was really, really hard. Again, more child anxiety, more fits, more big sobs. We didn’t have to deal with the emotions, fears, and frustrations of this pandemic before. It takes time and emotional energy.

4. Task requirements. There’s so much more to do now in the shorter days. Managing classes now requires a massive email investment. A one-minute conversation to solve a problem now is a five-minute email.

5. Fatigue. Although we didn’t really do childcare before, we did … you know … leave the house. Variation of external stimuli and working environments is apparently really important. I would, you know, be in the presence of other humans and change up my physical space by going to the office.

This is all to say: reconciling work and childcare is so much more difficult under covid-19. If you’re struggling, I hope this message shows you that it’s not just about smoothing out these two massive tasks. It’s that you’re doing so in an extraordinary time. I think my experience doing so without and with a global pandemic can help reveal that if you’re struggling, it’s not you and it’s not your kids and it’s not just dealing with the general problem of reconciling childcare and work. You’re doing this in a super, super difficult time. It was …so…much easier to square the circle in normal times.

Lives of despair, part 2. Working hard while hardly working?

Inspired by the wonderful blog, Just the Social Facts, Ma’am, I’m taking a look at a few attitudinal questions from the General Social Survey, comparing trends between the white working class (WWC) and white respondents with a college degree or more (the white credentialed class)?

Last time, I showed that polarization around the idea of hard work has been occurring since the 1990s, with the WWC increasing in belief of the importance of hard work while those with college degree remained relatively flat. Similarly, those with a college degree have really started to think that luck or help is important in getting ahead since 2016.

Here, I ask the question: to what extent do these attitudes vary across education/class divides, compared to differences in attachment to the labor market? For example, perhaps unemployed / decommodified WWC don’t buy into the idea of hard work, but more WWC folks are working over time. Thus, we might be observing shifts in views about success driven by employment patterns, not class patterns.

Briefly, I estimated similar multinomial logistic regression models as last time. I included an interaction with a three category variable: [1] working full/part time [2] unemployed [3] other (e.g. house-maker, retired, student). Because models blew up if I included year as a categorical variable, I experimented with different functional forms and found a cubic version of year to fit best. I interacted cubic year-by-class-by-employment category and plotted the probabilities.

First, let’s look at the probabilities of viewing hard work as the reason for success. Results are plotted separately for the WWC and those with a college degree.


Wow! Different things going on. Here’s what I see:

  • Most importantly, the WWC has converged in agreement that hard work is what gets one ahead. The unemployed had lower probabilities of viewing hard work as important until about 2010. Now, all three categories have similarly high levels.

  • While college educated workers have overall lower probabilities of “Hard work,” we see that employment categories began to diverge in their views around 2000. While employed individuals kept growing slightly in views of hard work, “other” and “unemployed” declined pretty substantially.

  • The groups didn’t look too different from one another through about, oh 2000? College / non-college employed looked pretty similar, college / non-college other looked pretty similar. Class differences really started driving attitudinal differences in the 2000s and onward.

So over time, the WWC has unified in views of hard work, while employment provides a wedge in views about hard work among those with a college degree.

What about luck or help? Let’s take a look at similar trends by education and employment.

I notice a few things:

  • A general decline across all categories from 1980 onward among the WWC, although the unemployed have higher probabilities in just about every time point.

  • In the last decade, 2010-2018, the highly educated unemployed have higher probabilities of “Luck/help” than the WWC unemployed. This is a reversal from earlier decades, where unemployed WWC were more likely to buy into the luck/help explanation than unemployed with a college degree.

  • There’s a break in trends among college educated employed / others following the great recession. From 1972-2006ish, higher and lower educated employed and other folks followed similar trends. Then, in 2008 onward, higher educated folks, regardless of (de)commodification status, have really bought into the luck/help explanation.

So what are the big take home points? I think that views of hard work or luck/help have become anchors of class mentality among white Americans, and that this is a recent phenomenon - beginning in the Clinton or Bush eras.

  1. The view that hard work results in success clearly has taken on an ideological meaning. The trends before 2000 make more sense to me via a basic materialist explanation — e.g. if you’re working, you attribute success to hard work, while if you’re unemployed, you are not likely to base your lack of success in the labor market on your lack of hard work. The WWC appear to have really bought into hard work as an anchor of meaning, even among those who are especially down on their luck (e.g. unemployed).

  2. Before, I noticed that higher educated workers separated in their view of “luck/help” in 2016. But apparently, this based on the consolidation of folks across employed / unemployed / other categories buying into a luck/help explanation following the great recession. I’ll need to look at that a bit more carefully and formally before making any final decision.

  3. The 1990s / 2000s marks a massive divergence between the WWC and higher educated whites in terms of views of getting ahead. We see this in overall trends (part 1), as well as across employed/unemployed/other groups.

I think next I’ll look at subjective views of one’s economic conditions, how these have changed over time, and how they map onto views of success.

Lives of despair, part 1. How do people get ahead?

David Weakliem has a wonderful blog, Just the Social Facts, Ma'am. He's an expert on public opinion and routinely posts interesting descriptive analyses of trends on a variety of topics.

He recently posted a great series titled Lives of Despair. The goal is to assess whether deaths of despair among the US white working class, documented and popularized by the work of Case and Deaton, are preceded by lives of despair, or a general separation of feelings of malaise between whites in different class locations, roughly proxied by whether one has a college degree or not. Weakliem follows trends in a variety of attitudinal data from the General Social Survey (GSS) and assesses how the white working class (WWC) differs from white respondents with a college degree. It's great stuff, I learned a lot and just loved it.

This post follows up with some minor methological adjustment that may help highlight some subtletly below the overall trends Weakliem documents.

Let's begin by focusing on one specific attitudinal item, the getahead question asked by the GSS: "Some people say that people get ahead by their own hard work; others say that lucky breaks or help from other people are more important. Which do you think is most important?" Answer choices are: (1) Hard work (2) Both equally (3) Luck or help. Weakliem takes the mean responses by year and plots differences between white respondents with, and without, a college degree. Below are his results.

As you can see, views have recently diverged about how one gets ahead. Weakliem argues that the divergence began during the great recession.

What changes when you treat getahead as nominal?

The GSS variable getahead doesn’t look either very continuous or ordinal to me. And critically, basic tests of ordinality, such as the Brant test, suggest that a simple ordered logistic regression model with year contrasts interacted with a college-non college binary variable violates the parallel regression assumption (Chi square value in the hundreds), which we need to think of these categories as ordered. This is all to say: the mean may be masking important nonlinear variation in trends across the categories. So let’s replicate Weakliem’s descriptive assessment using a simple multinomial logistic regression model and see if we can notice any additional relevant trends over time. Below are my results.

_blog01-getahead1.png

I plotted probabilities from the multinomial logit models for each of the three categories over time. A few things jump out to me:

  1. For respondents with a college degree, probabilities for both the “Hard work” and “Both equally” categories remained pretty stable over time, while we see a fairly big jump in the “Luck or help” category in 2016 and 2018.

  2. There’s no real action among the white working class (WWC) in the “Luck or help” category. No trend that I see.

  3. We see a massive positive shift from about 2000 onward for the WWC in the “Hard Work” category (although you could argue it began in 1980). The probability of falling in this category increased from 0.65 in 2000 to 0.8 in 2018.

  4. In 2016 and 2018, there’s a large drop in the probability of “Both” among the WWC, from about 0.2 to 0.1.

So what are the big points? (1) It looks like something around 2016 caused massive polarization in views about “Luck” between higher and lower educated people. (2) The WWC has been growing in its belief in “Hard Work” since 2000. This growth appears to have predated the Great Recession.

OK this is getting fun!! Let’s take a look at marginal effects of education over time across the three categories. These may better illustrate gaps between classes over time. Below we look at differences in the probabilities for each getahead category between the WWC and those with a college degree, separately by year. Values above zero indicate that WWC have a higher probability of falling into this category. Dashed lines are 95% confidence intervals.

  1. The WWC had a pretty persistent higher probability of choosing “Hard Work,” especially from the mid-1990s and onward. We then saw sizable growth of this gap in 2016 and 2018, the first time where the marginal effect was at or above 0.15 for 2 straight waves.

  2. College educated folks consistently had higher probabilities of “Both” from the 1990s onward. By now, the difference is looking fairly entrenched.

  3. We see a college / WWC gap for “Luck” emerge for the first time in 2016 and 2018.

  4. It’s also interesting that we observe few consistent education differences in the 1970s and 1980s. Educational polarization is a fairly recent phenomenon, occurring during and after the Clinton administration.

So taken all together: the gap in viewpoints about getting ahead between those with a college degree and the WWC has been around since the mid-1990s. The WWC has become distinct in its privileging of hard work since around 2000. And it seems that polarization around luck/help emerged in 2016.

Why is this happening? Good question. I’m not sure yet. Here are a few lingering questions I have:

  • What are cohort and age effects? My murky knowledge of work on the WWC is that the mortality occurs among the middle aged. Would we see these trends in that group? If these trends are driven by, say, seniors, then it’d be tough to connect them to a “lives of despair” argument.

  • Do views get locked into cohorts , or do they vary across age within cohorts over time?

  • To what extent are we seeing selection effects over time? Presumably those uncertain about how specifically to make it these days would probably try and go to college, because one of the few clear messages you hear about economic success is, “Go to college” (although there is some inaccurate pushback these days).

  • Are college graduates in the 1990s onward more likely to know the kinds of people who do, in fact, get ahead in life and have greater information to the pathways that resulted in making it? I know a few (not many) very affluent folks. Knowing what I know, I wouldn’t attribute all their rise to hard work.

  • Weakliem noted that the view of hard work among the WWC is tricky to reconcile with a lives of despair argument. I actually come down with somewhat of an opposite perspective. If you attribute success and failure mostly to your own efforts, well, then what do you make of life when the massive structural factors out of your control — computerization, union decimation, stagnating minimum wage, the China shock, resource hoarding among elites — all hit you in a span of two decades? It certainly feels like a depressing and mortifying combination of factors.

Some thoughts on working at home with young kids

I have seen lots of stress on Twitter and think pieces in the news about working with kids at home. I've learned a few lessons on this topic while using minimal daycare during the four years prior to my new position at the University of Minnesota last semester (one year was my final in graduate school and then three were on the tenure track). I had, in the end, two small kids, between the ages of zero and four during these years. There was one semester with two days a week, two hour child care (graduate school), one semester with five hours a week of childcare, and one semester with six hours of babysitting. Otherwise, we were DYI. Now, I'm in a two-body problem academic household. So my advice really only holds when there are partners around and both have some flexibility to their schedules. Take what you will from this. My advice obviously won't apply to all situations. Below, when I say "you," I'm generally talking about rules that worked for my spouse and me.

Oh, and in a follow up post, I will discuss how this global pandemic / potential economic collapse feels a heck of a lot different than my previous years of intensive childcare, and how I have struggled (...or maybe more accurately...failed) to follow through on some of the advice below.

Schedules

  1. You must make a schedule and stick to it, almost no matter what. You are near a breakthrough in your writing, but it's your partner's time to work? Too bad. Hope you remember it when you're back on the clock. Lowers resentment, increases fairness.

  2. Your work is now defined by hours, not tasks. It's easier, in my opinion, to let hours fill into your tasks to complete them. Now, the minutes tick away. And you either do or don't get your stuff finished in a finite amount of time. It's a mindset change.

  3. There are 24 hours in the day. You're now in a situation where ALL are on the table for appropriate work time. Our schedule typically went from 4am - 6:00pm devoted exclusively to switching between either childcare or work. Right now, in response to covid-19, our schedule stretches from 4am to 7pm. It's painful, but is what needs to happen for us to cram as much into the day as we can.

  4. Severe reciprocity. You have a newly scheduled hour-long meeting pop up that absolutely CANNOT be moved, but that is in your partner's time? This might mean that you don't get to linger at the end of the meeting. And it might mean that you cook dinner tonight solo and don't get to shower before passing out into bed. But you MUST give an hour back to your partner if you take one.

  5. Don't count on long periods where you make little breakthroughs. Work isn't a long drink of tea throughout the afternoon. It's a shot of espresso. You must lock in, focus, and you'll likely feel fatigued at the end.

Expectations

  1. I became EXTREMELY uninteresting over those four years. I worked, spent time with my kids, and slept. That's it. To your new favorite tv show, say "thank you for your service." I transitioned to watching one or two five-minute Youtube clips before falling asleep. I love myself and I love my family, but I had to BS when people on job interviews probed my cultural capital and leisure activities.

  2. We had a break at Christmas, and for a few weeks over the summer while we visited family. But don't hold a carrot of imminent change in front of you. Get used to the situation.

  3. There are seven days in the week. They're all on the table to do the three things you must do: work, childcare, sleep.

The actual work

  1. You need to change yourself to fit your new restrictions. You can't change your schedule to fit your preferred working habits. You're hour based now. Get 40 hours in or as close to 40 hours as you can, anywhere. If you can't get all your tasks done in 40 hours, that means you need to change how you work. Faster, more efficient, more forgiving of typos, less productive than what you'd like.

  2. You're hour based now. I've heard, and seen, people taking breaks on the job -- chatting with colleagues, watching youtube, reading twitter, doing non-core work activities, lingering. Now that I've been task-based for awhile, I've started to do this too. You can do that, but you won't get the things done that you must absolutely get done. This feels really bad, and in many ways it IS really sad, but say goodbye to those non-core things.

  3. You must, must ... MUST say goodbye to the internet and to the social media. Or at minimum, you must rigorously schedule them, and keep timers going when you're using them. Use harsh, unforgiving accuracy when measuing the amount of your day that you view the internet.

  4. Lists are your friend. I like to spend 5 minutes beginning and ending my work time centering myself on what I need to do (at the start) and what I did do (at the end). I use the program Workflowy and love it.

Happiness and emotion management

  1. Draw a bright line between childcare and work. Don't blend. If you must blend, then you must recognize that you are leaving your children unattended to do work. That puts the proper weight on your decision in this new arrangement.

  2. To the best you can, be in the moment. When you're working, you must work. When you're parenting, you must parent. We both found that mixing tasks while living this strange blended life caused anxiety, sadness, and problems.

  3. This may just be me, but while I was in a more isolated situation, the internet and social media made me feel sad, paranoid, resentful, and mad. I also recognized that I checked it out of compulsion to manage my worries, anxiety, and feelings of loneliness (it of course did not resolve any of these feelings). I found the casual use of internet/social media to be especially problematic in this situation.

It's not all bad!

  1. The four years of intensive childcare were probably the happiest of my life. And I had some very happy times prior to them! It's super hard, but it also feels super meaningful and rewarding.

  2. You'll be more likely to be around for very important parts of your kids' lives. For example, my son took his first steps to me on a random Wednesday afternoon in 2018. I'm very happy to have been there.

I haven't talked much publicly about this experience. I typically fibbed about my childcare situation for fears of being viewed as uncommitted to my work (lots of thoughts on this...). There are strong norms in my field of viewing academic work as a calling and a passion. There are lots of jokes about how work is better and easier than childcare. I'm in a much more privileged position than most others to violate these norms, but I still sensed the importance of conforming to these occpuational expectations. But now that many of us are in this new strange boat, I thought these lessons might help smooth your transition into the weird world of blended home/work.

Please, be good and generous to yourself and others. Take good care of yourself.